The purpose of these values is to help you evaluate the overall activity or success of an ad, product, or page within the e-commerce ecosystem.
Evo-1: Represents the evolution of reach data (such as the number of impressions recorded on the ad platform) over the last 24 hours.
Evo-3: Represents the same metric, but calculated over the last three days.
The activity level is derived from publicly available data fetched from online ads.
However, collecting this data is not always straightforward.
For various reasons, some data may occasionally be unavailable — for example:
- The advertising platform might be under maintenance and temporarily provide no information.
- The platform’s response time may exceed our timeout threshold, causing some ads to be skipped.
- GearLAB itself may be undergoing maintenance, which can interrupt data collection for a short period.
In short, we do our best with the data available, applying certain tolerances to handle these real-world imperfections.
These tolerances ensure the system remains stable and meaningful even when data is incomplete.
Data Tolerances#
GearLAB applies two main tolerance rules:
- 3-Day Tolerance Window
If data for a given ad is unavailable for up to 3 days, the ad is still considered active.
If no data is available for more than 3 consecutive days, the ad is marked inactive. - Interpolation of Missing Data
When some data points are missing within a valid period, GearLAB estimates the missing values by interpolating between the nearest available data points.
This approach provides a realistic mean value instead of reporting “No Data”.
Examples#
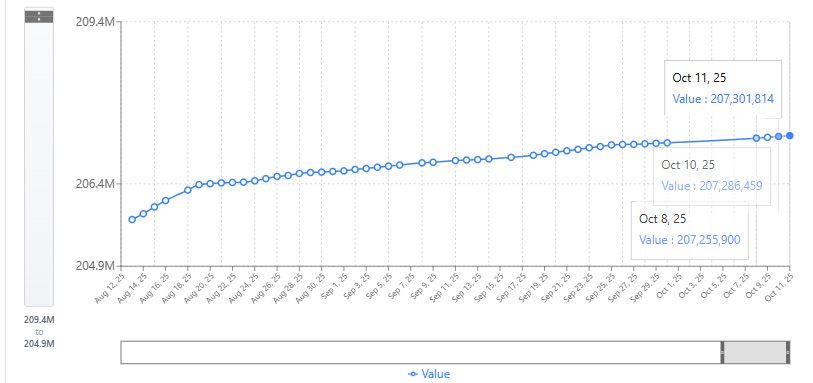
Market Reach Chart Example (latest values)
Example Context
- The last available data is from October 11th, 2025.
- Data for EVO-1 (Oct 10th) and EVO-3 (Oct 8th) are also available.
Case 1: Within the 3-Day Tolerance
If today is October 11th, data up to October 14th (Day + 3) can still be used confidently.
EVO-1 = 207,301,844 − 207,286,459 = 15,385
EVO-3 = 207,301,844 − 207,255,900 = 45,944
Case 2: Beyond the Tolerance
If today is October 15th (Day + 4) or later, both EVO-1 and EVO-3 values are set to 0,
as the data is now considered outdated.
Case 3: Missing Data Within the Tolerance
.jpg)
Market Reach Chart with missing data
The data point for October 8th is missing, but data exists for September 30th and October 9th.
The missing value for October 8th is interpolated using the surrounding data points.
Summary#
You now understand the logic behind EVO-1 and EVO-3 calculations.
Although real-world data can occasionally be incomplete, GearLAB intelligently handles these variations —
providing accurate, consistent, and meaningful activity indicators in a simple and transparent way.